MONTE CARLO RETIREMENT SIMULATION
How to read a retirement simulation without mistaking it for a promise.
A single projected retirement date assumes a particular future. A Monte Carlo simulation explores many return sequences so you can see how differently the same plan could turn out.
The key distinction: a range of balances, a range of FIRE dates, and the share of simulations that run out of money answer different questions. None guarantees a real-world outcome.
What does a Monte Carlo retirement simulation do?
Instead of applying the same return every year, a simulation generates many different sequences of annual returns. Each path follows a plan for saving, stopping contributions, or withdrawing money. You can then compare the balances and outcomes across those paths.
Coastful runs about 2,000 simulated futures around your expected return and volatility assumptions. Your asset mix informs the portfolio assumptions. The results are generated on your device; they are not forecasts obtained from a market-prediction service.
Expected return
The growth assumption around which yearly returns vary. A higher assumed return can make the modeled plan look easier to fund.
Volatility
The amount yearly returns can vary. Increasing it explores a wider range of market paths rather than simply changing the steady growth line.
How to read the line and the shaded range
The solid line is a separate projection of your plan at the assumed return with no volatility. It is not generated by the Monte Carlo simulations, and it is not their average or median. It does not have to sit in the center of the shading.
The shaded band comes from the Monte Carlo simulations. It shows the middle 80% of simulated balances at each year: the 10th to 90th percentiles of the amounts held at that point. Some simulated balances are below it and some are above it. It does not describe one particular path through time.
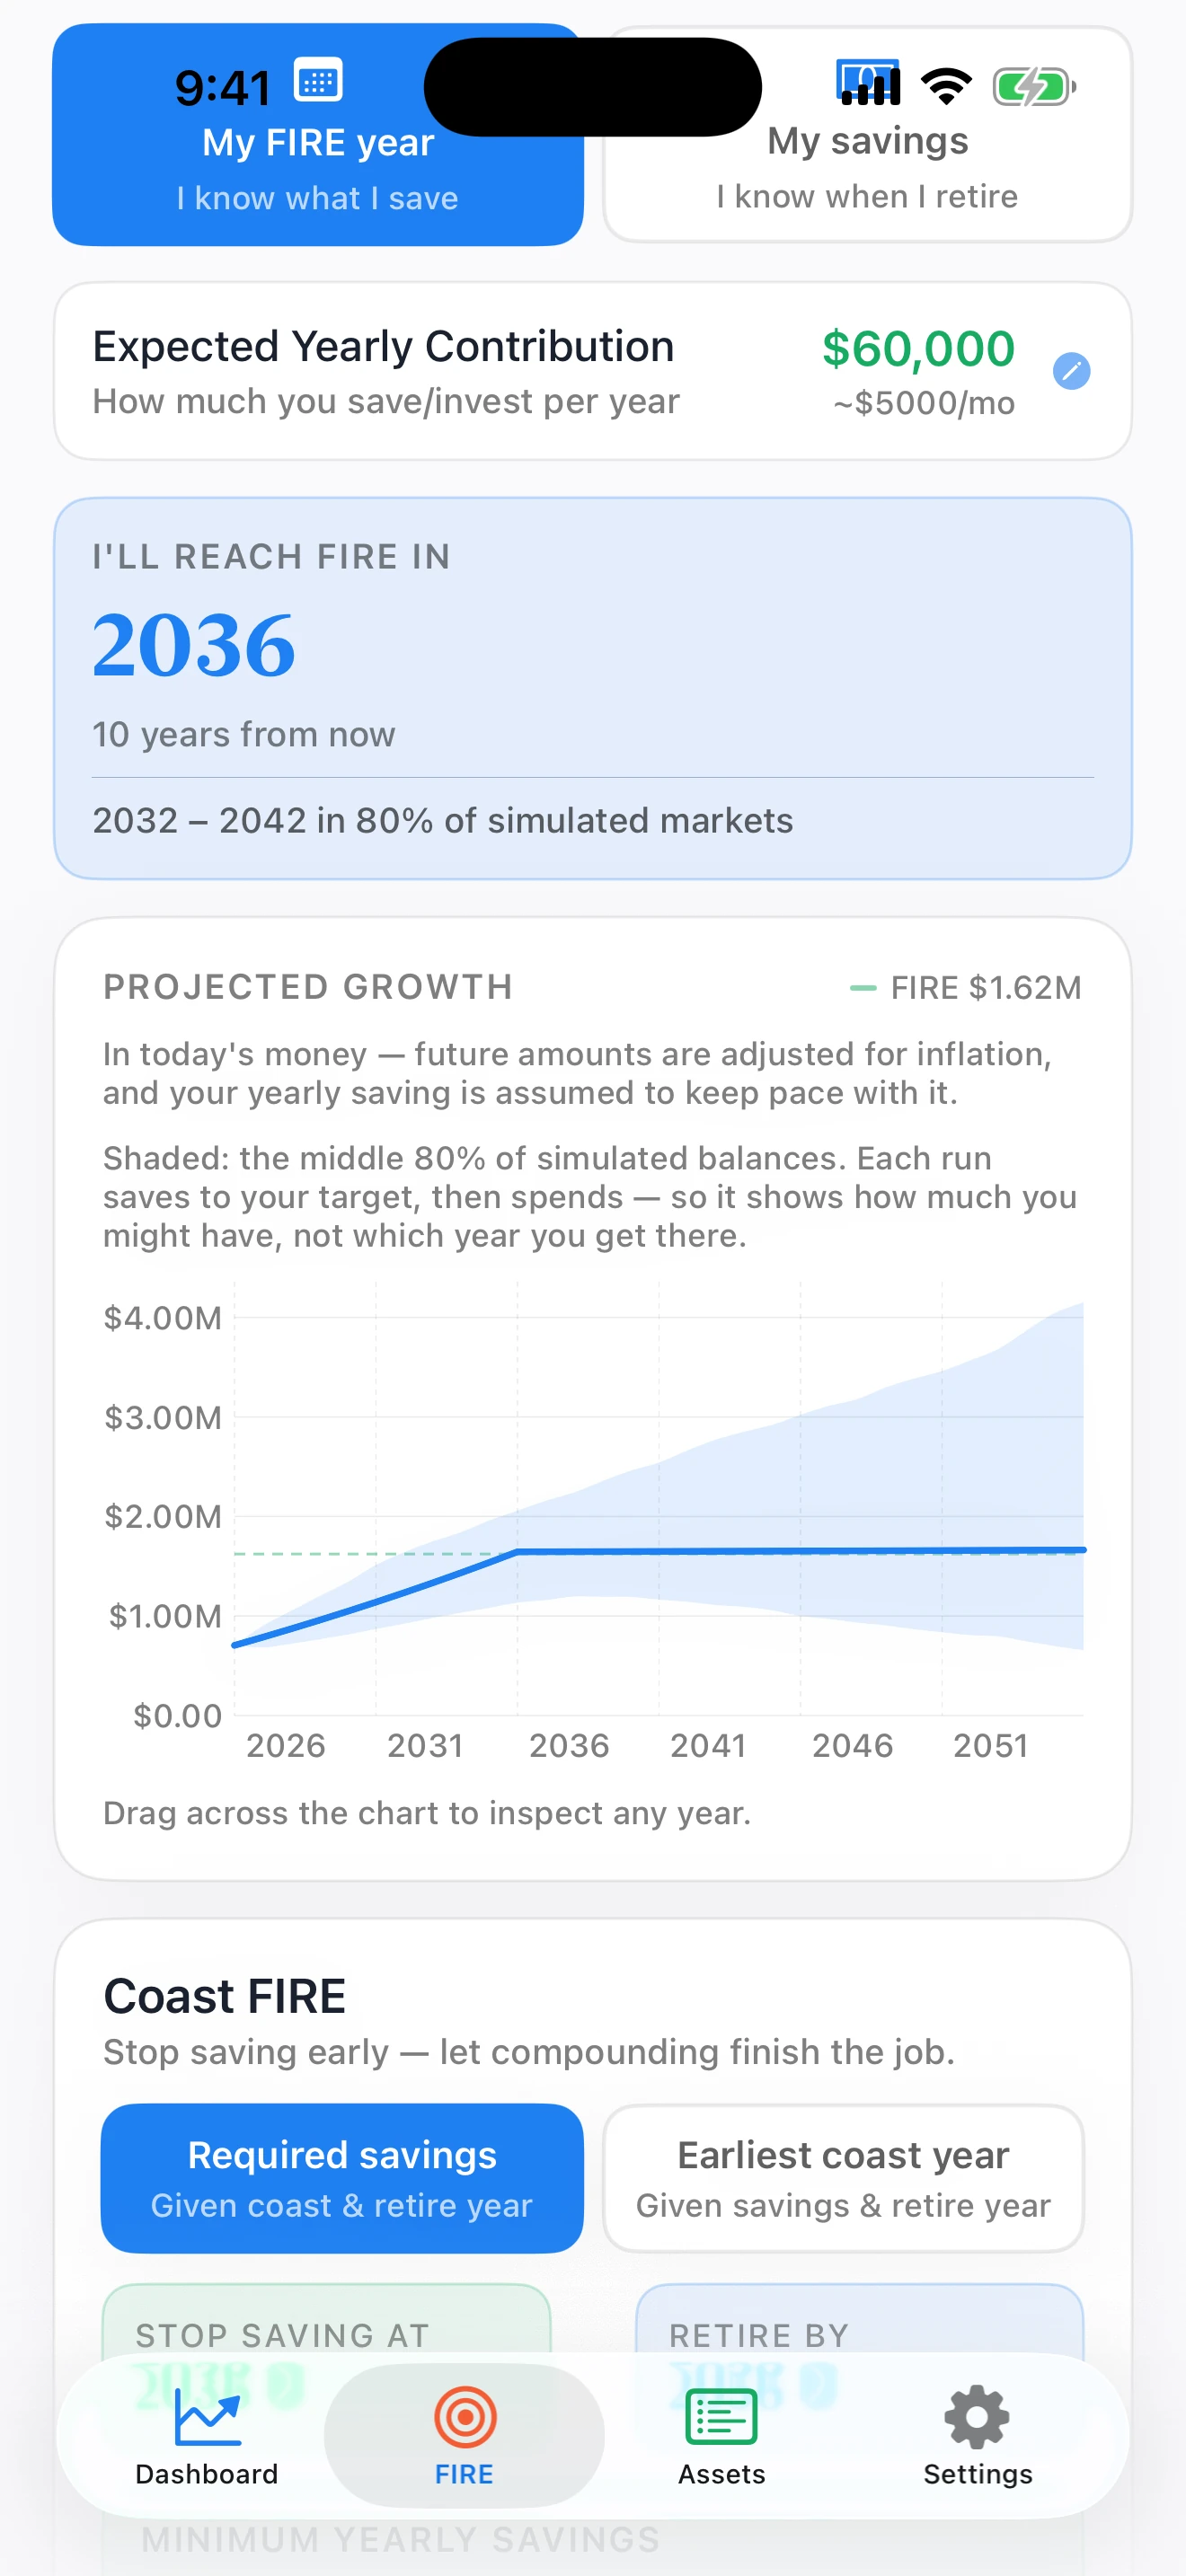
Read the caption for the chart you are viewing. A FIRE projection, a Coast FIRE plan, and a retirement withdrawal plan follow different saving and spending rules. For example, a coast path stops new contributions at the chosen coast year; a retirement path draws the specified spending after retirement.
Three questions that should not be combined
1. How much might the portfolio hold in a year?
The shaded balance range answers this. A lower edge above zero in one year does not establish that every simulated path is funded throughout retirement.
2. When might the portfolio reach its FIRE target?
A FIRE-year range is calculated from the target-reaching dates of simulated paths. It is a range of dates, not a range of money. Some assumptions may produce no useful date range; the app can show a warning rather than imply a precise answer.
3. Does a retirement plan run out of money?
That requires following each simulated path through withdrawals. Where Coastful displays a depletion percentage, it describes the share of simulated markets that run out of money by the selected year. An 80% balance band is not an 80% chance of success.
What should you test in your own plan?
- Spending and savings: include irregular expenses and test whether your planned contributions are realistic.
- Expected returns: try less favorable growth assumptions instead of relying on one optimistic figure.
- Volatility: review the category defaults and any per-asset overrides. These are modeling assumptions, not live forecasts.
- Inflation: Coastful shows projections in today’s money. Keep spending and growth assumptions consistent with the app’s real-dollar treatment.
- Withdrawal rate: compare the base 4% target with the personalized assumption or your own rate. A rate derived from expected real return is not a guarantee of sustainable withdrawals.
- Pension access: set when locked funds become available so the years before access are not funded by money you cannot yet withdraw.
- Time horizon and remaining assets: with Pro, explore retirement spending and the amount you want left in a future year.
Change one assumption at a time, then compare the result. Use a deliberate what-if market-drop scenario to test a specific shock; use Monte Carlo paths to explore many varying return sequences. They complement each other.
What a simulation cannot promise
Simulation results are hypothetical. They depend on the return model, volatility assumptions, asset mix, spending rules, and time horizon. Real markets can behave differently, and personal circumstances can change. The model cannot certify a retirement date or an individually safe withdrawal rate.
Do not assume a chart covers taxes, fees, pension eligibility rules, or every possible market event unless those effects are explicitly represented in the inputs and model. Review the app’s explanations and your own account rules.
For a simpler comparison using a fixed growth assumption, the SEC’s Investor.gov compound interest calculator lets you explore contributions, time, and interest-rate ranges. It is a separate educational tool, not an endorsement of Coastful.
Educational planning, not financial advice. Use the results to understand assumptions and compare scenarios. Seek qualified advice for decisions specific to your situation.
Coastful includes Monte Carlo projections in its core FIRE calculator. Pro adds Coast FIRE and retirement spending plans.
See Coastful’s simulation features →